PRINT AS PDF
During the most recent three-year period for which data from the Bureau of Labor Statistics is available (2011-2014), higher education employment growth and median wage growth lagged the national figures. During that three year period, national employment increased 1.7% per year and the national median wage rose 1.0% per year (red point).
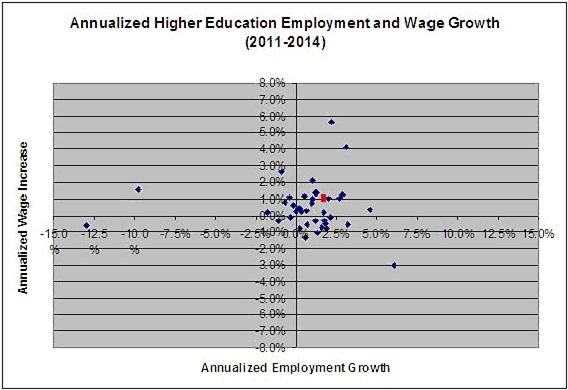
During 2011-14, 31% of higher education occupations saw employment increase at a rate that was faster than the average national employment growth rate while 69% saw relatively slower employment growth. Nearly a quarter (23%) of such occupations saw employment shrink over the three-year period.
In terms of wage growth during 2011-14, 31% of higher education occupations also saw the median wage increase at a rate that was faster than the national average for median wages, while 69% saw relatively slower growth in the median wage. Nearly two-in-five occupations (39%) saw a decrease in the median wage during the three-year period.
Overall, wage inequality in higher education was nearly the same as for all occupations. In higher education, the 75th percentile wage was 2.2 times the 25th percentile wage and the 90th percentile wage was 4.8 times the 10th percentile wage. Nationally, the 75th percentile wage was 2.5 times the 25th percentile wage and the 90th percentile wage was 4.9 times the 10th percentile wage.
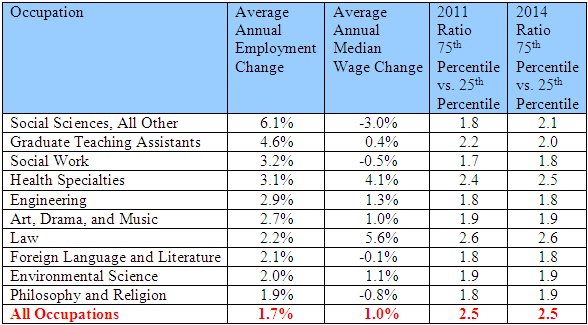
The 10 higher education occupation areas that saw the fastest annualized employment growth over the past three years were as follows:
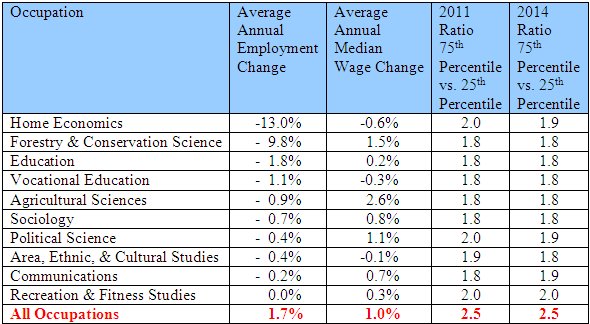
The 10 higher education occupations that saw the worst three-year employment growth over the past three years were as follows:
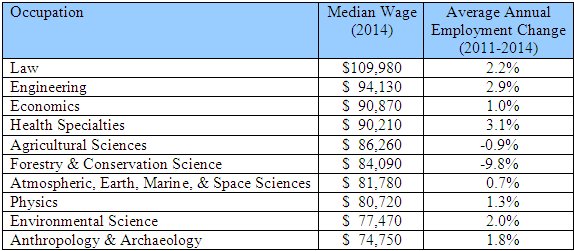
The ten occupations paying the highest median wage saw employment grow an average of 2.4% per year during 2011-14, bringing total employment to 282,630. Those occupations were as follows:
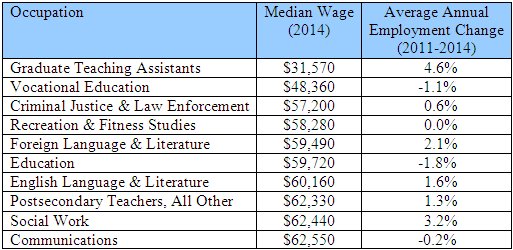
The ten occupations paying the highest median wage saw employment grow an average of 1.1% per year during 2011-14, bringing total employment to 677,880. Those occupations were as follows: