
PRINT AS PDF
Lehman College’s mission statement declares that the College “serves the Bronx and surrounding region as an intellectual, economic, and cultural center.” Toward that end, a majority of Lehman College’s undergraduate and graduate students are residents of New York City. In fall 2016, nearly 80% of undergraduate students and 67% of graduate students were residents of the City.
Access to relevant occupational and wage data for the local area can inform decision making by students, faculty, and staff. Occupational Employment Statistics (OES) Data for the New York City-Jersey City-White Plains region provides insight into employment, occupational, and wage data in the College’s focus area. Below are four tables that provide such data for the May 2015-May 2016 period (released March 31, 2017), along with the relevant O*Net Job Zone figure for each occupation. O*Net’s Job Zones reflect the level of preparedness required for each occupation.
20 Biggest Occupations with an Above Area Median Wage:
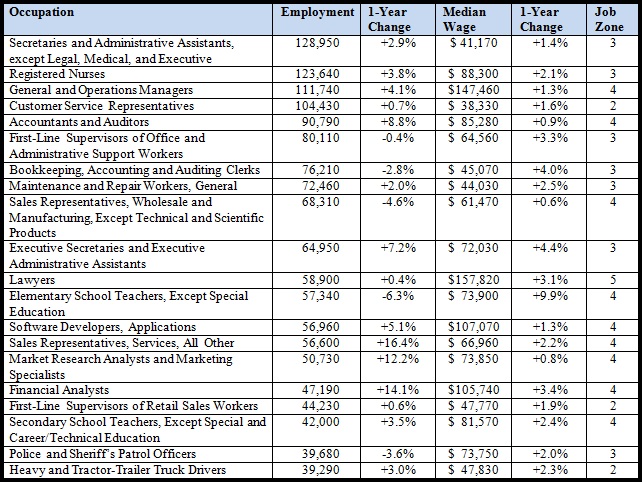
Mean Job Zone: 3.4; Job Zones 3 or Above: 85%
20 Fastest Growing Occupations with 10,000 or More Employees over the Past Year:
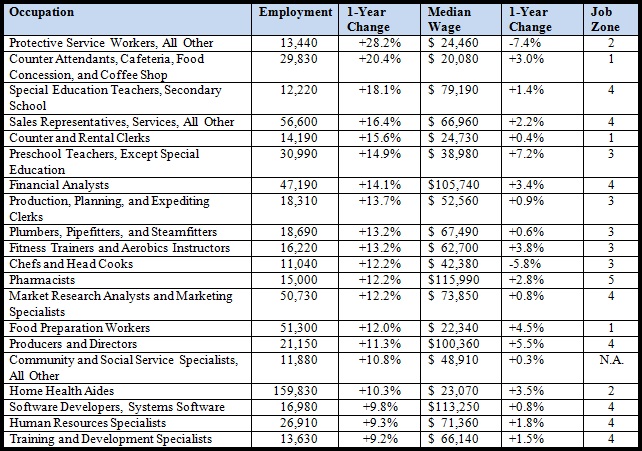
Mean Job Zone: 3.1; Job Zones 3 or Above: 74%
Most Attractive Occupations (10,000 or more employees):
(Above median employment growth; above median wage; and, above median wage change)
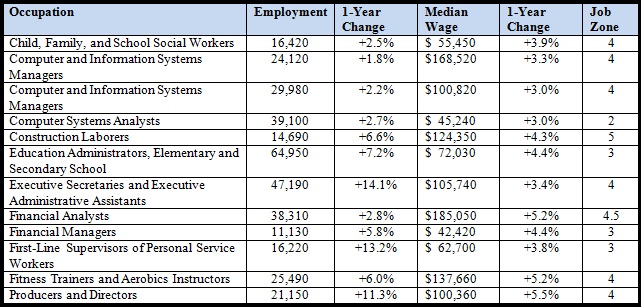
Mean Job Zone: 3.7; Job Zones 3 or Above: 92%
Least Attractive Occupations (10,000 or more employees):
(Decline in employment, below median wage, below median wage change)

Mean Job Zone: 2.0; Job Zones 3 or Above: 9%
O*Net Job Zones:
1: Little or no preparation needed
2: Some preparation needed
3: Medium preparation needed
4: Considerable preparation needed
5: Extensive preparation needed